Computational tools: regioneR and regioneReloaded
How to make sense from the overlap of multiple epigenomic data sets? The R package regioneR allows you to statistically assess overlaps from two ChIP-seqs or any other data sets generating genomic regions as output (Gel et al., 2015, Bioinformatics).

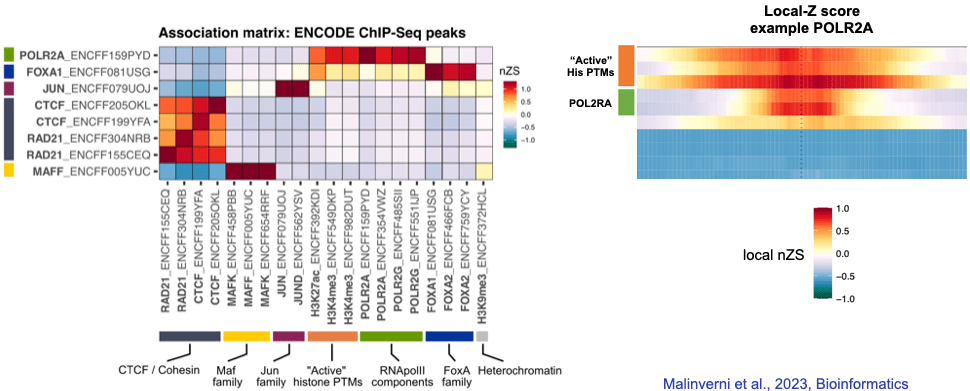
RegioneReloaded is a package that allows simultaneous analysis of associations between genomic region sets, enabling clustering of data and the creation of ready-to-publish graphs (Malinverni et al., 2023, Bioinformatics). It takes over and expands on all the features of its predecessor regioneR. It also incorporates a strategy to improve p-value calculations and normalize z-scores coming from multiple analysis to allow for their direct comparison. (https://bioconductor.org/packages/release/bioc/html/regioneReloaded.html)
Cell lines
A number of cell lines generated and/or identified in the lab are available from DSMZ. These includes a series of skin cells with progressive transformed characteristics (Cantariño et al., 2016, Int J Cancer) and two leukemia cell subclones that can serve as models to test for vulnerabilities associated with gains and losses of chromosomes 7, 8 and 18 (Maher, Diesch et al., 2021, Sci Rep).